 |
|||||
 |
|||||
 |
|||||
 |
|||||
| IL |
 |
||
 |
||||
 |
||||
 |
|
 |
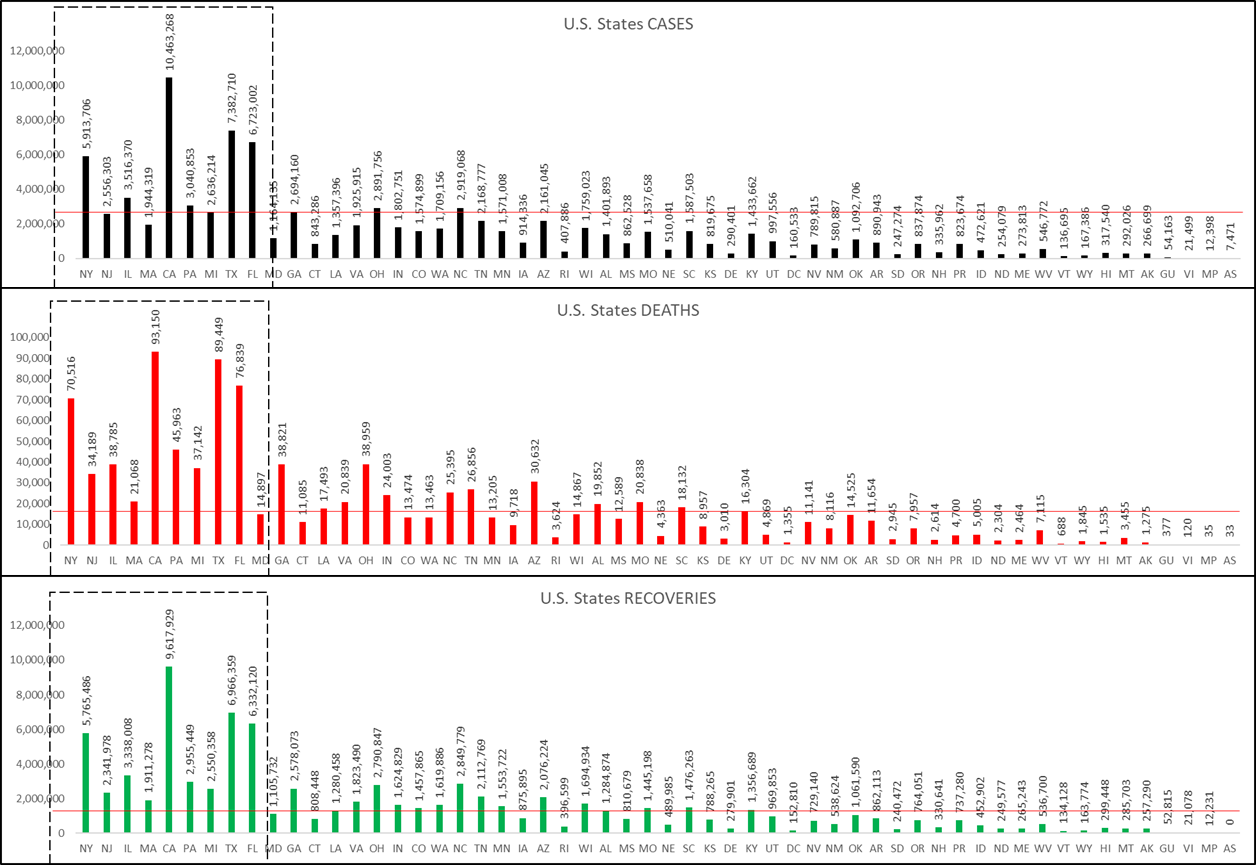
| United States STATES and DISTRICTS and TERRITORIES MONTHLY Cumulitive Statistics - daily live data feed | |||||||||||||||||||||||||||||||||||||||||||||||||||||||||||||||||||||||||||||||||||||||
| Last Updated: | 7/21/2022 | CASES | DEATHS | RECOVERIES | D2R | C2D+R | FORECAST MODEL (Plateau Start) | ||||||||||||||||||||||||||||||||||||||||||||||||||||||||||||||||||||||||||||||||
| STATE | REGION | 1st Case | Days | CASES | PREV | NET NEW | % of U.S. | % of POP | DEATHS | % of U.S. | % of POP | RECOVERIES[1] | % of U.S. | % of POP | Gap | D+R | Gap | % Pending | NET NEW | DAYS | DATE | ST | TOTAL CASES | TOTAL DEATHS | TOTAL RECOVERIES | DEATHS+RECOVERIES | CASES DEATHS+RECOVERIES GAP | STATES AND TERRITORIES | CITIES | DAYS FOR FIRST TIME VIRUS TO SPREAD BETWEEN STATES | |||||||||||||||||||||||||||||||||||||||||||||||||||||||||
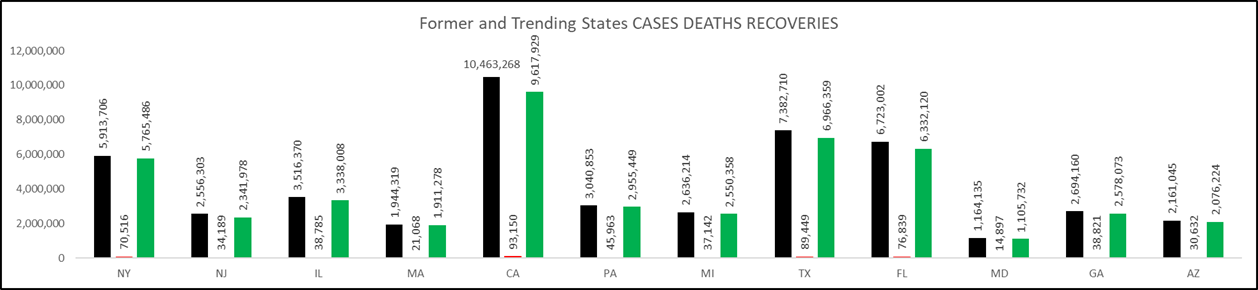
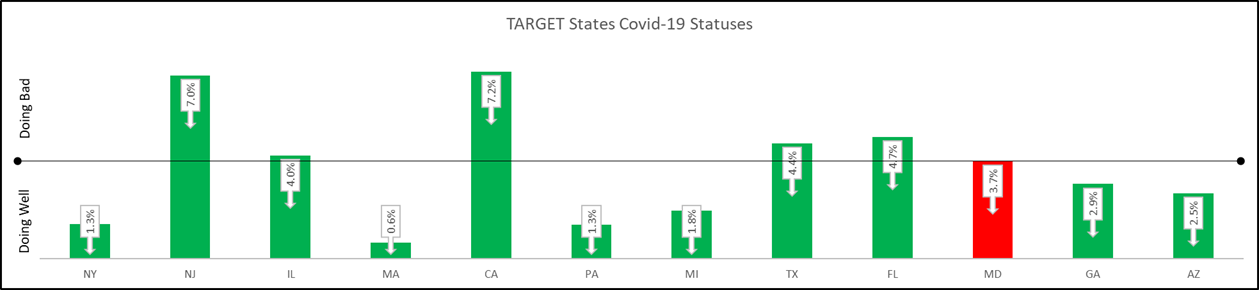
| NY | northeast | 3/1/20 | 872 | 5,913,706 | 5,902,281 | 11,425 | 6.6% | 30.4% | 70,516 | 6.9% | 0.4% | 5,765,486 | 6.7% | 29.7% | 5,694,970 | 5,836,002 | 77,704 | 1.3% | 11,425 | 31 | 8/21/2022 | NY | 90,065,089 | 1,024,604 | 85,477,832 | 86,502,436 | 3,562,653 | Rank | Abbrev | State | Region | Population | Rank | City | Population | STATE | REGION | 1st Case | Days to Spread | ||||||||||||||||||||||||||||||||||||||||||||||||
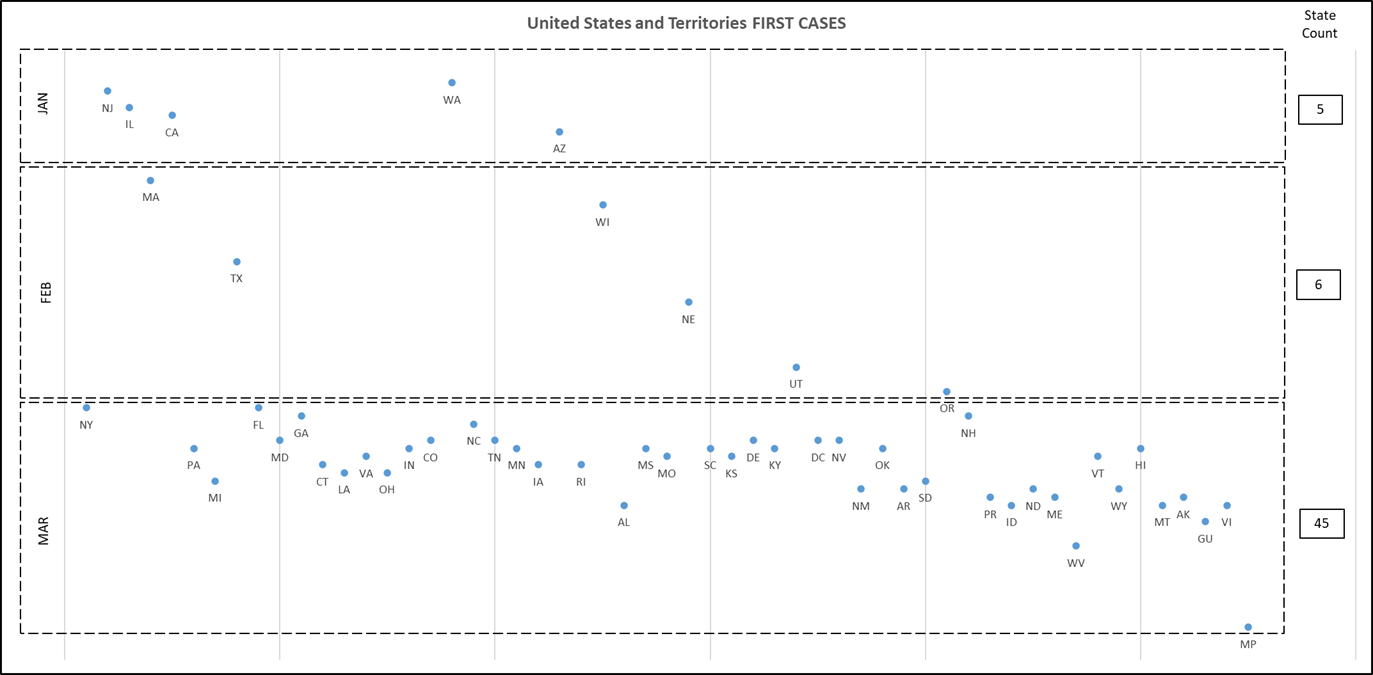
| NJ | northeast | 1/22/20 | 911 | 2,556,303 | 2,548,015 | 8,288 | 2.8% | 28.6% | 34,189 | 3.3% | 0.4% | 2,341,978 | 2.7% | 26.2% | 2,307,789 | 2,376,167 | 180,136 | 7.0% | 8,288 | 23 | 8/12/2022 | NJ | 1 | CA | California | west | 39,937,489 | CA | 1 | New York City | 8,175,133 | WA | northeast | 1/21/20 | 0 | ||||||||||||||||||||||||||||||||||||||||||||||||||||
| IL | midwest | 1/24/20 | 909 | 3,516,370 | 3,507,262 | 9,108 | 3.9% | 27.8% | 38,785 | 3.8% | 0.3% | 3,338,008 | 3.9% | 26.4% | 3,299,223 | 3,376,793 | 139,577 | 4.0% | 9,108 | 25 | 8/14/2022 |
|
2 | TX | Texas | southwest | 29,472,295 | TX | 2 | Los Angeles | 3,971,883 | NJ | northeast | 1/22/20 | 1 | ||||||||||||||||||||||||||||||||||||||||||||||||||||
| MA | northeast | 2/2/20 | 900 | 1,944,319 | 1,944,319 | 0 | 2.2% | 27.9% | 21,068 | 2.1% | 0.3% | 1,911,278 | 2.2% | 27.4% | 1,890,210 | 1,932,346 | 11,973 | 0.6% | 0 | 0 | 7/21/2022 | MA | 3 | FL | Florida | southeast | 21,992,985 | FL | 3 | Chicago | 2,720,546 | IL | midwest | 1/24/20 | 2 | ||||||||||||||||||||||||||||||||||||||||||||||||||||
| CA | west | 1/25/20 | 908 | 10,463,268 | 10,452,333 | 10,935 | 11.6% | 26.2% | 93,150 | 9.1% | 0.2% | 9,617,929 | 11.3% | 24.1% | 9,524,779 | 9,711,079 | 752,189 | 7.2% | 10,935 | 30 | 8/19/2022 | CA | 4 | NY | New York | northeast | 19,440,469 | NY | 4 | Brooklyn | 2,300,664 | CA | west | 1/25/20 | 1 | ||||||||||||||||||||||||||||||||||||||||||||||||||||
| PA | northeast | 3/6/20 | 867 | 3,040,853 | 3,040,853 | 0 | 3.4% | 23.7% | 45,963 | 4.5% | 0.4% | 2,955,449 | 3.5% | 23.1% | 2,909,486 | 3,001,412 | 39,441 | 1.3% | 0 | 0 | 7/21/2022 | PA | 5 | PA | Pennsylvania | northeast | 12,820,878 | PA | 5 | Houston | 2,296,224 | AZ | southwest | 1/27/20 | 2 | ||||||||||||||||||||||||||||||||||||||||||||||||||||
| MI | northeast | 3/10/20 | 863 | 2,636,214 | 2,636,214 | 0 | 2.9% | 26.2% | 37,142 | 3.6% | 0.4% | 2,550,358 | 3.0% | 25.4% | 2,513,216 | 2,587,500 | 48,714 | 1.8% | 0 | 0 | 7/21/2022 | MI | 6 | IL | Illinois | midwest | 12,659,682 | IL | 6 | Queens | 2,272,771 | MA | northeast | 2/2/20 | 6 | ||||||||||||||||||||||||||||||||||||||||||||||||||||
| TX | southwest | 2/12/20 | 890 | 7,382,710 | 7,372,657 | 10,053 | 8.2% | 25.0% | 89,449 | 8.7% | 0.3% | 6,966,359 | 8.1% | 23.6% | 6,876,910 | 7,055,808 | 326,902 | 4.4% | 10,053 | 28 | 8/17/2022 | TX | 7 | OH | Ohio | midwest | 11,747,694 | OH | 7 | Philadelphia | 1,567,442 | WI | midwest | 2/5/20 | 3 | ||||||||||||||||||||||||||||||||||||||||||||||||||||
| FL | southeast | 3/1/20 | 872 | 6,723,002 | 6,711,131 | 11,871 | 7.5% | 30.6% | 76,839 | 7.5% | 0.3% | 6,332,120 | 7.4% | 28.8% | 6,255,281 | 6,408,959 | 314,043 | 4.7% | 11,871 | 33 | 8/22/2022 | FL | 8 | GA | Georgia | southeast | 10,736,059 | GA | 8 | Phoenix | 1,563,025 | TX | southwest | 2/12/20 | 7 | ||||||||||||||||||||||||||||||||||||||||||||||||||||
| MD | northeast | 3/5/20 | 868 | 1,164,135 | 1,158,585 | 5,550 | 1.3% | 19.1% | 14,897 | 1.5% | 0.2% | 1,105,732 | 1.3% | 18.2% | 1,090,835 | 1,120,629 | 43,506 | 3.7% | 5,550 | 15 | 8/5/2022 | MD | 9 | NC | North Carolina | southeast | 10,611,862 | NC | 9 | Manhattan | 1,487,536 | NE | midwest | 2/17/20 | 5 | ||||||||||||||||||||||||||||||||||||||||||||||||||||
| GA | southeast | 3/2/20 | 871 | 2,694,160 | 2,694,160 | 0 | 3.0% | 25.1% | 38,821 | 3.8% | 0.4% | 2,578,073 | 3.0% | 24.0% | 2,539,252 | 2,616,894 | 77,266 | 2.9% | 0 | 0 | 7/21/2022 | GA | 10 | MI | Michigan | northeast | 10,045,029 | MI | 10 | San Antonio | 1,469,845 | UT | west | 2/25/20 | 8 | ||||||||||||||||||||||||||||||||||||||||||||||||||||
| CT | northeast | 3/8/20 | 865 | 843,286 | 842,712 | 574 | 0.9% | 23.7% | 11,085 | 1.1% | 0.3% | 808,448 | 0.9% | 22.7% | 797,363 | 819,533 | 23,753 | 2.8% | 574 | 2 | 7/22/2022 | CT | 11 | NJ | New Jersey | northeast | 8,936,574 | NJ | 11 | San Diego | 1,394,928 | OR | west | 2/28/20 | 3 | ||||||||||||||||||||||||||||||||||||||||||||||||||||
| LA | southeast | 3/9/20 | 864 | 1,357,396 | 1,350,727 | 6,669 | 1.5% | 29.2% | 17,493 | 1.7% | 0.4% | 1,280,458 | 1.5% | 27.6% | 1,262,965 | 1,297,951 | 59,445 | 4.4% | 6,669 | 18 | 8/8/2022 | LA | 12 | VA | Virginia | southeast | 8,626,207 | VA | 12 | The Bronx | 1,385,108 | NY | northeast | 3/1/20 | 2 | ||||||||||||||||||||||||||||||||||||||||||||||||||||
| VA | southeast | 3/7/20 | 866 | 1,925,915 | 1,919,590 | 6,325 | 2.1% | 22.3% | 20,839 | 2.0% | 0.2% | 1,823,490 | 2.1% | 21.1% | 1,802,651 | 1,844,329 | 81,586 | 4.2% | 6,325 | 17 | 8/7/2022 | VA | 13 | WA | Washington | northeast | 7,797,095 | WA | 13 | Dallas | 1,300,092 | FL | southeast | 3/1/20 | 0 | ||||||||||||||||||||||||||||||||||||||||||||||||||||
| OH | midwest | 3/9/20 | 864 | 2,891,756 | 2,891,756 | 0 | 3.2% | 24.6% | 38,959 | 3.8% | 0.3% | 2,790,847 | 3.3% | 23.8% | 2,751,888 | 2,829,806 | 61,950 | 2.1% | 0 | 0 | 7/21/2022 | OH | 14 | AZ | Arizona | southwest | 7,378,494 | AZ | 14 | San Jose | 1,026,908 | GA | southeast | 3/2/20 | 1 | ||||||||||||||||||||||||||||||||||||||||||||||||||||
| IN | midwest | 3/6/20 | 867 | 1,802,751 | 1,802,751 | 0 | 2.0% | 26.7% | 24,003 | 2.3% | 0.4% | 1,624,829 | 1.9% | 24.1% | 1,600,826 | 1,648,832 | 153,919 | 8.5% | 0 | 0 | 7/21/2022 | IN | 15 | MA | Massachusetts | northeast | 6,976,597 | MA | 15 | Austin | 931,830 | NH | northeast | 3/2/20 | 0 | ||||||||||||||||||||||||||||||||||||||||||||||||||||
| CO | west | 3/5/20 | 868 | 1,574,899 | 1,572,861 | 2,038 | 1.7% | 26.9% | 13,474 | 1.3% | 0.2% | 1,457,865 | 1.7% | 24.9% | 1,444,391 | 1,471,339 | 103,560 | 6.6% | 2,038 | 6 | 7/26/2022 | CO | 16 | TN | Tennessee | southeast | 6,897,576 | TN | 16 | Jacksonville | 868,031 | NC | southeast | 3/3/20 | 1 | ||||||||||||||||||||||||||||||||||||||||||||||||||||
| WA | northeast | 1/21/20 | 912 | 1,709,156 | 1,709,156 | 0 | 1.9% | 21.9% | 13,463 | 1.3% | 0.2% | 1,619,886 | 1.9% | 20.8% | 1,606,423 | 1,633,349 | 75,807 | 4.4% | 0 | 0 | 7/21/2022 | WA | 17 | IN | Indiana | midwest | 6,745,354 | IN | 17 | San Francisco | 864,816 | MD | northeast | 3/5/20 | 2 | ||||||||||||||||||||||||||||||||||||||||||||||||||||
| NC | southeast | 3/3/20 | 870 | 2,919,068 | 2,919,068 | 0 | 3.2% | 27.5% | 25,395 | 2.5% | 0.2% | 2,849,779 | 3.3% | 26.9% | 2,824,384 | 2,875,174 | 43,894 | 1.5% | 0 | 0 | 7/21/2022 | NC | 18 | MO | Missouri | midwest | 6,169,270 | MO | 18 | Columbus | 850,106 | CO | west | 3/5/20 | 0 | ||||||||||||||||||||||||||||||||||||||||||||||||||||
| TN | southeast | 3/5/20 | 868 | 2,168,777 | 2,160,023 | 8,754 | 2.4% | 31.4% | 26,856 | 2.6% | 0.4% | 2,112,769 | 2.5% | 30.6% | 2,085,913 | 2,139,625 | 29,152 | 1.3% | 8,754 | 24 | 8/13/2022 | TN | 19 | MD | Maryland | northeast | 6,083,116 | MD | 19 | Fort Worth | 833,319 | TN | southeast | 3/5/20 | 0 | ||||||||||||||||||||||||||||||||||||||||||||||||||||
| MN | midwest | 3/6/20 | 867 | 1,571,008 | 1,571,008 | 0 | 1.7% | 27.6% | 13,205 | 1.3% | 0.2% | 1,553,722 | 1.8% | 27.3% | 1,540,517 | 1,566,927 | 4,081 | 0.3% | 0 | 0 | 7/21/2022 | MN | 20 | WI | Wisconsin | midwest | 5,851,754 | WI | 20 | Indianapolis | 829,718 | DE | northeast | 3/5/20 | 0 | ||||||||||||||||||||||||||||||||||||||||||||||||||||
| IA | midwest | 3/8/20 | 865 | 914,336 | 914,336 | 0 | 1.0% | 28.8% | 9,718 | 0.9% | 0.3% | 875,895 | 1.0% | 27.5% | 866,177 | 885,613 | 28,723 | 3.1% | 0 | 0 | 7/21/2022 | IA | 21 | CO | Colorado | west | 5,845,526 | CO | 21 | Charlotte | 827,097 | DC | northeast | 3/5/20 | 0 | ||||||||||||||||||||||||||||||||||||||||||||||||||||
| AZ | southwest | 1/27/20 | 906 | 2,161,045 | 2,161,045 | 0 | 2.4% | 29.3% | 30,632 | 3.0% | 0.4% | 2,076,224 | 2.4% | 28.1% | 2,045,592 | 2,106,856 | 54,189 | 2.5% | 0 | 0 | 7/21/2022 | AZ | 22 | MN | Minnesota | midwest | 5,700,671 | MN | 22 | Seattle | 684,451 | NV | west | 3/5/20 | 0 | ||||||||||||||||||||||||||||||||||||||||||||||||||||
| RI | northeast | 3/8/20 | 865 | 407,886 | 407,309 | 577 | 0.5% | 38.6% | 3,624 | 0.4% | 0.3% | 396,599 | 0.5% | 37.6% | 392,975 | 400,223 | 7,663 | 1.9% | 577 | 2 | 7/22/2022 | RI | 23 | SC | South Carolina | southeast | 5,210,095 | SC | 23 | Denver | 682,545 | PA | northeast | 3/6/20 | 1 | ||||||||||||||||||||||||||||||||||||||||||||||||||||
| WI | midwest | 2/5/20 | 897 | 1,759,023 | 1,754,646 | 4,377 | 2.0% | 30.1% | 14,867 | 1.5% | 0.3% | 1,694,934 | 2.0% | 29.0% | 1,680,067 | 1,709,801 | 49,222 | 2.8% | 4,377 | 12 | 8/1/2022 | WI | 24 | AL | Alabama | southeast | 4,908,621 | AL | 24 | El Paso | 681,124 | IN | midwest | 3/6/20 | 0 | ||||||||||||||||||||||||||||||||||||||||||||||||||||
| AL | southeast | 3/13/20 | 860 | 1,401,893 | 1,396,285 | 5,608 | 1.6% | 28.6% | 19,852 | 1.9% | 0.4% | 1,284,874 | 1.5% | 26.2% | 1,265,022 | 1,304,726 | 97,167 | 6.9% | 5,608 | 15 | 8/5/2022 | AL | 25 | LA | Louisiana | southeast | 4,645,184 | LA | 25 | Detroit | 677,116 | MN | midwest | 3/6/20 | 0 | ||||||||||||||||||||||||||||||||||||||||||||||||||||
| MS | southeast | 3/6/20 | 867 | 862,528 | 859,352 | 3,176 | 1.0% | 28.9% | 12,589 | 1.2% | 0.4% | 810,679 | 0.9% | 27.1% | 798,090 | 823,268 | 39,260 | 4.6% | 3,176 | 9 | 7/29/2022 | MS | 26 | KY | Kentucky | southeast | 4,499,692 | KY | 26 | Boston | 667,137 | MS | southeast | 3/6/20 | 0 | ||||||||||||||||||||||||||||||||||||||||||||||||||||
| MO | midwest | 3/7/20 | 866 | 1,537,658 | 1,537,658 | 0 | 1.7% | 24.9% | 20,838 | 2.0% | 0.3% | 1,445,198 | 1.7% | 23.4% | 1,424,360 | 1,466,036 | 71,622 | 4.7% | 0 | 0 | 7/21/2022 | MO | 27 | OR | Oregon | west | 4,301,089 | OR | 27 | Memphis | 655,770 | SC | southeast | 3/6/20 | 0 | ||||||||||||||||||||||||||||||||||||||||||||||||||||
| NE | midwest | 2/17/20 | 885 | 510,041 | 508,139 | 1,902 | 0.6% | 26.1% | 4,363 | 0.4% | 0.2% | 489,985 | 0.6% | 25.1% | 485,622 | 494,348 | 15,693 | 3.1% | 1,902 | 5 | 7/26/2022 | NE | 28 | OK | Oklahoma | southeast | 3,954,821 | OK | 28 | New South Memphis | 641,608 | KY | southeast | 3/6/20 | 0 | ||||||||||||||||||||||||||||||||||||||||||||||||||||
| SC | southeast | 3/6/20 | 867 | 1,587,503 | 1,573,585 | 13,918 | 1.8% | 30.5% | 18,132 | 1.8% | 0.3% | 1,476,263 | 1.7% | 28.3% | 1,458,131 | 1,494,395 | 93,108 | 5.9% | 13,918 | 38 | 8/28/2022 | SC | 29 | CT | Connecticut | northeast | 3,563,077 | CT | 29 | Portland | 632,309 | OK | southeast | 3/6/20 | 0 | ||||||||||||||||||||||||||||||||||||||||||||||||||||
| KS | midwest | 3/7/20 | 866 | 819,675 | 819,675 | 0 | 0.9% | 28.2% | 8,957 | 0.9% | 0.3% | 788,265 | 0.9% | 27.1% | 779,308 | 797,222 | 22,453 | 2.7% | 0 | 0 | 7/21/2022 | KS | 30 | UT | Utah | west | 3,282,115 | UT | 30 | Oklahoma City | 631,346 | HI | west | 3/6/20 | 0 | ||||||||||||||||||||||||||||||||||||||||||||||||||||
| DE | northeast | 3/5/20 | 868 | 290,401 | 290,110 | 291 | 0.3% | 29.5% | 3,010 | 0.3% | 0.3% | 279,901 | 0.3% | 28.5% | 276,891 | 282,911 | 7,490 | 2.6% | 291 | 1 | 7/21/2022 | DE | 31 | IA | Iowa | midwest | 3,179,849 | IA | 31 | Las Vegas | 623,747 | VA | southeast | 3/7/20 | 1 | ||||||||||||||||||||||||||||||||||||||||||||||||||||
| KY | southeast | 3/6/20 | 867 | 1,433,662 | 1,426,716 | 6,946 | 1.6% | 31.9% | 16,304 | 1.6% | 0.4% | 1,356,689 | 1.6% | 30.2% | 1,340,385 | 1,372,993 | 60,669 | 4.2% | 6,946 | 19 | 8/9/2022 | KY | 32 | NV | Nevada | west | 3,139,658 | NV | 32 | Baltimore | 621,849 | MO | midwest | 3/7/20 | 0 | ||||||||||||||||||||||||||||||||||||||||||||||||||||
| UT | west | 2/25/20 | 877 | 997,556 | 997,556 | 0 | 1.1% | 30.4% | 4,869 | 0.5% | 0.1% | 969,853 | 1.1% | 29.5% | 964,984 | 974,722 | 22,834 | 2.3% | 0 | 0 | 7/21/2022 | UT | 33 | AR | Arkansas | southeast | 3,038,999 | AR | 33 | Louisville | 602,111 | KS | midwest | 3/7/20 | 0 | ||||||||||||||||||||||||||||||||||||||||||||||||||||
| DC | northeast | 3/5/20 | 868 | 160,533 | 159,729 | 804 | 0.2% | 22.3% | 1,355 | 0.1% | 0.2% | 152,810 | 0.2% | 21.2% | 151,455 | 154,165 | 6,368 | 4.0% | 804 | 2 | 7/23/2022 | DC | 34 | PR | Puerto Rico | territory | 3,032,165 | PR | 34 | Washington, D.C. | 601,723 | VT | northeast | 3/7/20 | 0 | ||||||||||||||||||||||||||||||||||||||||||||||||||||
| NV | west | 3/5/20 | 868 | 789,815 | 789,815 | 0 | 0.9% | 25.2% | 11,141 | 1.1% | 0.4% | 729,140 | 0.9% | 23.2% | 717,999 | 740,281 | 49,534 | 6.3% | 0 | 0 | 7/21/2022 | NV | 35 | MS | Mississippi | southeast | 2,989,260 | MS | 35 | Milwaukee | 600,155 | CT | northeast | 3/8/20 | 1 | ||||||||||||||||||||||||||||||||||||||||||||||||||||
| NM | southwest | 3/11/20 | 862 | 580,887 | 579,993 | 894 | 0.6% | 27.7% | 8,116 | 0.8% | 0.4% | 538,624 | 0.6% | 25.7% | 530,508 | 546,740 | 34,147 | 5.9% | 894 | 2 | 7/23/2022 | NM | 36 | KS | Kansas | midwest | 2,910,357 | KS | 36 | South Boston | 571,281 | IA | midwest | 3/8/20 | 0 | ||||||||||||||||||||||||||||||||||||||||||||||||||||
| OK | southeast | 3/6/20 | 867 | 1,092,706 | 1,092,706 | 0 | 1.2% | 27.6% | 14,525 | 1.4% | 0.4% | 1,061,590 | 1.2% | 26.8% | 1,047,065 | 1,076,115 | 16,591 | 1.5% | 0 | 0 | 7/21/2022 | OK | 37 | NM | New Mexico | southwest | 2,096,640 | NM | 37 | Albuquerque | 559,121 | RI | northeast | 3/8/20 | 0 | ||||||||||||||||||||||||||||||||||||||||||||||||||||
| AR | southeast | 3/11/20 | 862 | 890,943 | 887,373 | 3,570 | 1.0% | 29.3% | 11,654 | 1.1% | 0.4% | 862,113 | 1.0% | 28.4% | 850,459 | 873,767 | 17,176 | 1.9% | 3,570 | 10 | 7/30/2022 | AR | 38 | NE | Nebraska | midwest | 1,952,570 | NE | 38 | Tucson | 531,641 | LA | southeast | 3/9/20 | 1 | ||||||||||||||||||||||||||||||||||||||||||||||||||||
| SD | west | 3/10/20 | 863 | 247,274 | 247,274 | 0 | 0.3% | 27.4% | 2,945 | 0.3% | 0.3% | 240,472 | 0.3% | 26.6% | 237,527 | 243,417 | 3,857 | 1.6% | 0 | 0 | 7/21/2022 | SD | 39 | ID | Idaho | west | 1,826,156 | ID | 39 | Nashville | 530,852 | OH | midwest | 3/9/20 | 0 | ||||||||||||||||||||||||||||||||||||||||||||||||||||
| OR | west | 2/28/20 | 874 | 837,874 | 836,353 | 1,521 | 0.9% | 19.5% | 7,957 | 0.8% | 0.2% | 764,051 | 0.9% | 17.8% | 756,094 | 772,008 | 65,866 | 7.9% | 1,521 | 4 | 7/25/2022 | OR | 40 | WV | West Virginia | southeast | 1,778,070 | WV | 40 | Fresno | 520,052 | MI | northeast | 3/10/20 | 1 | ||||||||||||||||||||||||||||||||||||||||||||||||||||
| NH | northeast | 3/2/20 | 871 | 335,962 | 335,855 | 107 | 0.4% | 24.5% | 2,614 | 0.3% | 0.2% | 330,641 | 0.4% | 24.1% | 328,027 | 333,255 | 2,707 | 0.8% | 107 | 0 | 7/21/2022 | NH | 41 | HI | Hawaii | west | 1,412,687 | HI | 41 | Sacramento | 490,712 | SD | west | 3/10/20 | 0 | ||||||||||||||||||||||||||||||||||||||||||||||||||||
| PR | territory | 3/12/20 | 861 | 823,674 | 819,657 | 4,017 | 0.9% | 27.2% | 4,700 | 0.5% | 0.2% | 737,280 | 0.9% | 24.3% | 732,580 | 741,980 | 81,694 | 9.9% | 4,017 | 11 | 8/1/2022 | PR | 42 | NH | New Hampshire | northeast | 1,371,246 | NH | 42 | Kansas City | 475,378 | NM | southwest | 3/11/20 | 1 | ||||||||||||||||||||||||||||||||||||||||||||||||||||
| ID | west | 3/13/20 | 860 | 472,621 | 472,621 | 0 | 0.5% | 25.9% | 5,005 | 0.5% | 0.3% | 452,902 | 0.5% | 24.8% | 447,897 | 457,907 | 14,714 | 3.1% | 0 | 0 | 7/21/2022 | ID | 43 | ME | Maine | northeast | 1,345,790 | ME | 43 | Long Beach | 474,140 | AR | southeast | 3/11/20 | 0 | ||||||||||||||||||||||||||||||||||||||||||||||||||||
| ND | west | 3/11/20 | 862 | 254,079 | 253,677 | 402 | 0.3% | 33.4% | 2,304 | 0.2% | 0.3% | 249,577 | 0.3% | 32.8% | 247,273 | 251,881 | 2,198 | 0.9% | 402 | 1 | 7/22/2022 | ND | 44 | MT | Montana | west | 1,086,759 | MT | 44 | Mesa | 471,825 | ND | west | 3/11/20 | 0 | ||||||||||||||||||||||||||||||||||||||||||||||||||||
| ME | northeast | 3/12/20 | 861 | 273,813 | 273,123 | 690 | 0.3% | 20.3% | 2,464 | 0.2% | 0.2% | 265,243 | 0.3% | 19.7% | 262,779 | 267,707 | 6,106 | 2.2% | 690 | 2 | 7/22/2022 | ME | 45 | RI | Rhode Island | northeast | 1,056,161 | RI | 45 | Staten Island | 468,730 | WY | west | 3/11/20 | 0 | ||||||||||||||||||||||||||||||||||||||||||||||||||||
| WV | southeast | 3/18/20 | 855 | 546,772 | 544,911 | 1,861 | 0.6% | 30.8% | 7,115 | 0.7% | 0.4% | 536,700 | 0.6% | 30.2% | 529,585 | 543,815 | 2,957 | 0.5% | 1,861 | 5 | 7/26/2022 | WV | 46 | DE | Delaware | northeast | 982,895 | DE | 46 | Atlanta | 463,878 | PR | territory | 3/12/20 | 1 | ||||||||||||||||||||||||||||||||||||||||||||||||||||
| VT | northeast | 3/7/20 | 866 | 136,695 | 136,695 | 0 | 0.2% | 21.8% | 688 | 0.1% | 0.1% | 134,128 | 0.2% | 21.4% | 133,440 | 134,816 | 1,879 | 1.4% | 0 | 0 | 7/21/2022 | VT | 47 | SD | South Dakota | west | 903,027 | SD | 47 | Colorado Springs | 456,568 | ME | northeast | 3/12/20 | 0 | ||||||||||||||||||||||||||||||||||||||||||||||||||||
| WY | west | 3/11/20 | 862 | 167,386 | 167,386 | 0 | 0.2% | 29.5% | 1,845 | 0.2% | 0.3% | 163,774 | 0.2% | 28.9% | 161,929 | 165,619 | 1,767 | 1.1% | 0 | 0 | 7/21/2022 | WY | 48 | ND | North Dakota | west | 761,723 | ND | 48 | Virginia Beach | 452,745 | AK | west | 3/12/20 | 0 | ||||||||||||||||||||||||||||||||||||||||||||||||||||
| HI | west | 3/6/20 | 867 | 317,540 | 317,540 | 0 | 0.4% | 22.5% | 1,535 | 0.1% | 0.1% | 299,448 | 0.4% | 21.2% | 297,913 | 300,983 | 16,557 | 5.2% | 0 | 0 | 7/21/2022 | HI | 49 | AK | Alaska | west | 734,002 | AK | 49 | Raleigh | 451,066 | AL | southeast | 3/13/20 | 1 | ||||||||||||||||||||||||||||||||||||||||||||||||||||
| MT | west | 3/13/20 | 860 | 292,026 | 292,026 | 0 | 0.3% | 26.9% | 3,455 | 0.3% | 0.3% | 285,703 | 0.3% | 26.3% | 282,248 | 289,158 | 2,868 | 1.0% | 0 | 0 | 7/21/2022 | MT | 50 | DC | District of Columbia | northeast | 720,687 | DC | 50 | Omaha | 443,885 | ID | west | 3/13/20 | 0 | ||||||||||||||||||||||||||||||||||||||||||||||||||||
| AK | west | 3/12/20 | 861 | 266,699 | 266,699 | 0 | 0.3% | 36.3% | 1,275 | 0.1% | 0.2% | 257,290 | 0.3% | 35.1% | 256,015 | 258,565 | 8,134 | 3.0% | 0 | 0 | 7/21/2022 | AK | 51 | VT | Vermont | northeast | 628,061 | VT | 51 | Miami | 441,003 | MT | west | 3/13/20 | 0 | ||||||||||||||||||||||||||||||||||||||||||||||||||||
| GU | territory | 3/15/20 | 858 | 54,163 | 53,865 | 298 | 0.1% | #N/A | 377 | 0.0% | #N/A | 52,815 | 0.1% | #N/A | 52,438 | 53,192 | 971 | 1.8% | 298 | 1 | 7/21/2022 | GU | 52 | WY | Wyoming | west | 567,025 | WY | 52 | Oakland | 419,267 | VI | territory | 3/13/20 | 0 | ||||||||||||||||||||||||||||||||||||||||||||||||||||
| VI | territory | 3/13/20 | 860 | 21,499 | 21,361 | 138 | 0.0% | #N/A | 120 | 0.0% | #N/A | 21,078 | 0.0% | #N/A | 20,958 | 21,198 | 301 | 1.4% | 138 | 0 | 7/21/2022 | VI | 53 | GU | Guam | territory | 168,775 | GU | 53 | Minneapolis | 410,939 | GU | territory | 3/15/20 | 2 | ||||||||||||||||||||||||||||||||||||||||||||||||||||
| MP | territory | 3/28/20 | 845 | 12,398 | 12,398 | 0 | 0.0% | #N/A | 35 | 0.0% | #N/A | 12,231 | 0.0% | #N/A | 12,196 | 12,266 | 132 | 1.1% | 0 | 0 | 7/21/2022 | MP | 54 | VI | United States Virgin I | territory | 109,977 | VI | 54 | Tulsa | 403,505 | WV | southeast | 3/18/20 | 3 | ||||||||||||||||||||||||||||||||||||||||||||||||||||
| AS | territory | n/a | 0 | 7,471 | 7,144 | 327 | 0.0% | #N/A | 33 | 0.0% | #N/A | 0 | 0.0% | #N/A | -33 | 33 | 7,438 | 99.6% | 327 | 1 | 7/21/2022 | AS | 55 | MP | Northern Mariana Isl | territory | 57,559 | MP | 55 | Wichita | 389,965 | MP | territory | 3/28/20 | 10 | ||||||||||||||||||||||||||||||||||||||||||||||||||||
|
|
TOTALS | 90,065,089 | 89,922,075 | 143,014 | 1.9% | 1,024,604 | 85,477,832 | AVG | 2,554 | 7 | 7/27/2022 | 56 | AS | American Samoa | territory | 55,191 | AS | 56 | New Orleans | 389,617 | AS | territory | n/a | na | |||||||||||||||||||||||||||||||||||||||||||||||||||||||||||||||
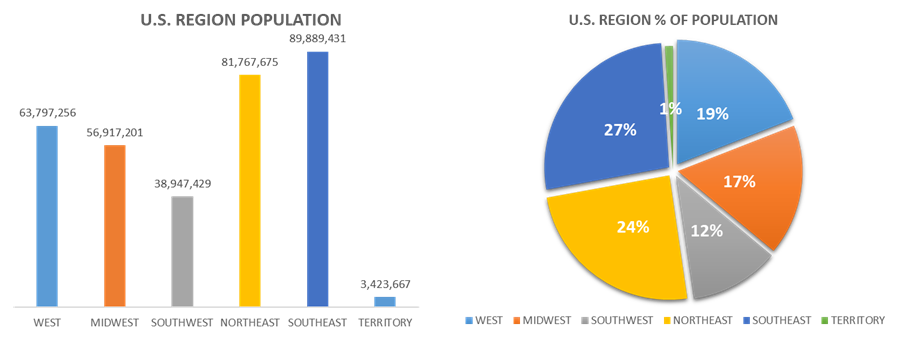
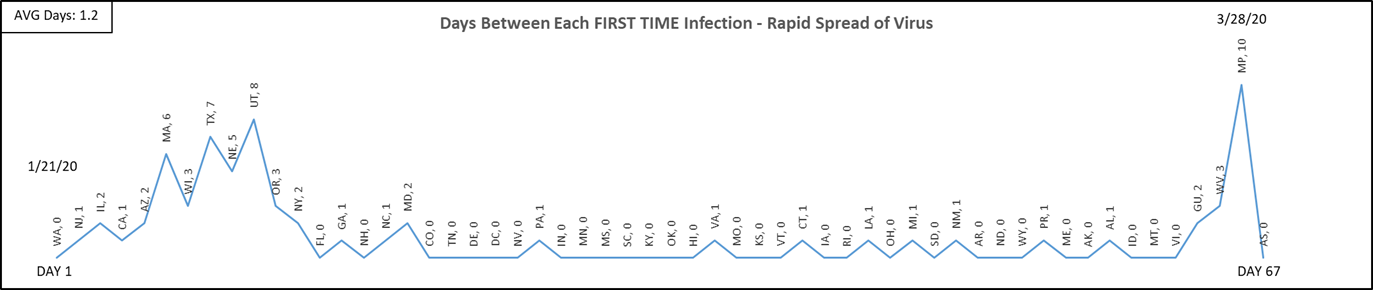
| U.S. REGIONS | 334,742,659 | 57 | Arlington | 388,125 | Total Days | 67 | |||||||||||||||||||||||||||||||||||||||||||||||||||||||||||||||||||||||||||||||||
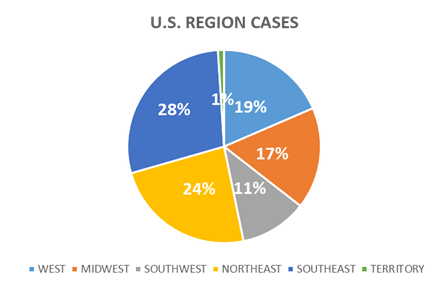
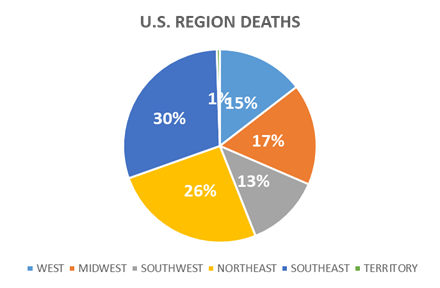
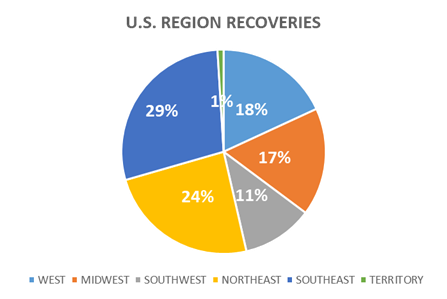
| POP | % | CASES | % | DEATHS | % | RECOVERIES | % | 58 | Cleveland | 388,072 | Avg | 1.2 | |||||||||||||||||||||||||||||||||||||||||||||||||||||||||||||||||||||||||||
| WEST | 63,797,256 | 19% | 16,681,037 | 19% | 148,955 | 15% | 15,488,004 | 18% | 59 | Bakersfield | 373,640 | ||||||||||||||||||||||||||||||||||||||||||||||||||||||||||||||||||||||||||||
| MIDWEST | 56,917,201 | 17% | 15,322,618 | 17% | 173,695 | 17% | 14,601,683 | 17% | 60 | Honolulu | 371,657 | NET NEW CASES - TOP 10 | |||||||||||||||||||||||||||||||||||||||||||||||||||||||||||||||||||||||||||
| SOUTHWEST | 38,947,429 | 12% | 10,124,642 | 11% | 128,197 | 13% | 9,581,207 | 11% |
|
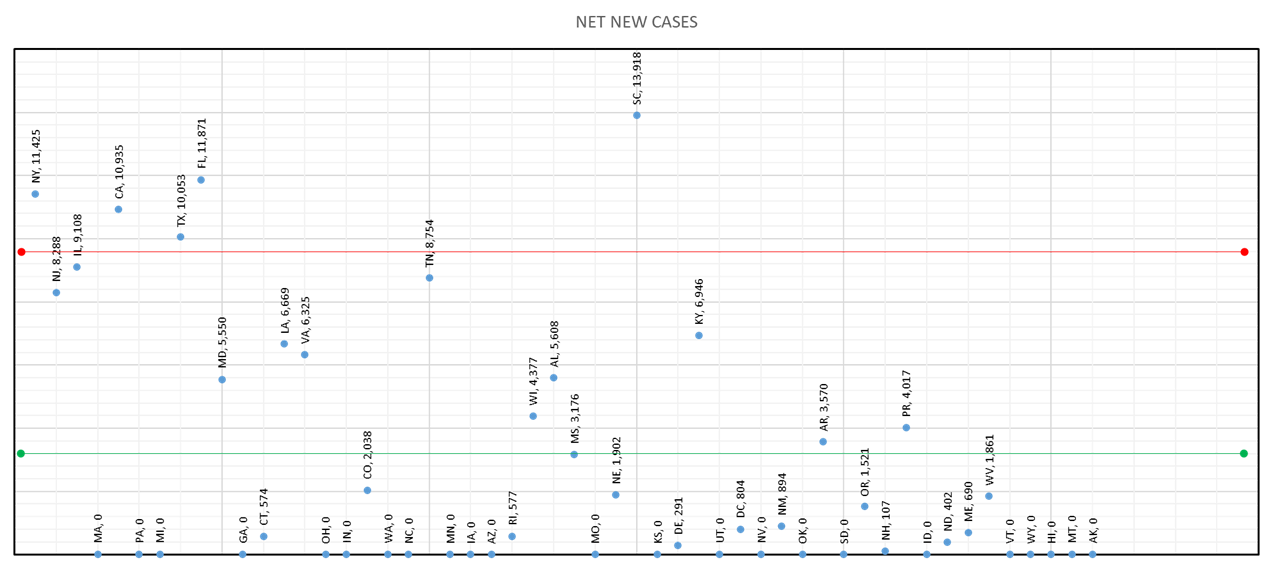
61 | Tampa | 369,075 | RANK | NET NEW | STATE | ||||||||||||||||||||||||||||||||||||||||||||||||||||||||||||||||||||||||
| NORTHEAST | 81,767,675 | 24% | 21,413,262 | 24% | 262,078 | 26% | 20,617,937 | 24% | 62 | Aurora | 359,407 | 1st | 13,918 | SC | |||||||||||||||||||||||||||||||||||||||||||||||||||||||||||||||||||||||||
| SOUTHEAST | 89,889,431 | 27% | 25,604,325 | 28% | 306,414 | 30% | 24,365,597 | 29% | 63 | Anaheim | 350,742 | 2nd | 11,871 | FL | |||||||||||||||||||||||||||||||||||||||||||||||||||||||||||||||||||||||||
| TERRITORY | 3,423,667 | 1% | 919,205 | 1% | 5,265 | 1% | 823,404 | 1% | 64 | West Raleigh | 338,759 | 3rd | 11,425 | NY | |||||||||||||||||||||||||||||||||||||||||||||||||||||||||||||||||||||||||
| 334,742,659 | 90,065,089 | 1,024,604 | 85,477,832 | 65 | Santa Ana | 335,400 | 4th | 10,935 | CA | ||||||||||||||||||||||||||||||||||||||||||||||||||||||||||||||||||||||||||||||
| 66 | Corpus Christi | 324,074 | 5th | 10,053 | TX | ||||||||||||||||||||||||||||||||||||||||||||||||||||||||||||||||||||||||||||||||||
|
|
67 | Riverside | 322,424 | 6th | 9,108 | IL | |||||||||||||||||||||||||||||||||||||||||||||||||||||||||||||||||||||||||||||||||
| 68 | St. Louis | 315,685 | 7th | 8,754 | TN | ||||||||||||||||||||||||||||||||||||||||||||||||||||||||||||||||||||||||||||||||||
| 69 | Lexington-Fayette | 314,488 | 8th | 8,288 | NJ | ||||||||||||||||||||||||||||||||||||||||||||||||||||||||||||||||||||||||||||||||||
| 70 | Stockton | 305,658 | 9th | 6,946 | KY | ||||||||||||||||||||||||||||||||||||||||||||||||||||||||||||||||||||||||||||||||||
| 71 | Pittsburgh | 304,391 | 10th | 6,669 | LA | ||||||||||||||||||||||||||||||||||||||||||||||||||||||||||||||||||||||||||||||||||
|
|||||||||||||||||||||||||||||||||||||||||||||||||||||||||||||||||||||||||||||||||||||||
|
|||||||||||||||||||||||||||||||||||||||||||||||||||||||||||||||||||||||||||||||||||||||